-
Products
-
Loudspeakers
- Atlas+Fyne IsoFlare™ Loudspeakers
- SHS Series
- In-Ceiling
- Surface Mount
- Pendent Mount Speakers
- IP Speakers
- Sound Masking Speakers
- Subwoofers
- Line Columns & Arrays
-
Speaker Components
- Speaker Drivers
- Transformers
-
Baffles & Back Boxes
- Blind Mount Enclosures
- EZ Mount Enclosures
- General Purpose Baffles
- Vandal Proof
- Q series
- Q Series - Square
- Recessed
- Torsion Baffles & Enclosures
- Cylindrical
- General Purpose Baffles - Square
- Recessed - Square
- Surface Mount Enclosures - Square
- Fire Rated
- 8" Speaker & Analog Clock
- Surface Mount Enclosures
- Mounting Rails
- Mounting Rings & Squares
- T Bar Bridge
- Portable Speakers
- Specialty Speakers
- Life Safety
- Horns
- Sound Masking
- Amplifiers
- GLOBALCOM® Enterprise Communication Ecosystem
- 5400 Series Life Safety Public Address System
- IP Solutions
- DSP / Signal Processors
- AC Power Distribution
- Racks and Cabinets
- Visual Displays
- Microphone & Mic Stands
- Classroom Audio Distribution
- Audio Accessories & Options
- Dante® Enabled Devices
- Buy America Act - Trade Agreements Act
- Discontinued Product
-
Loudspeakers
- Systems
- Markets
- Support
- Resources
- About Us
-
Products
-
Loudspeakers
- Atlas+Fyne IsoFlare™ Loudspeakers
- SHS Series
- In-Ceiling
- Surface Mount
- Pendent Mount Speakers
- IP Speakers
- Sound Masking Speakers
- Subwoofers
- Line Columns & Arrays
-
Speaker Components
- Speaker Drivers
- Transformers
-
Baffles & Back Boxes
- Blind Mount Enclosures
- EZ Mount Enclosures
- General Purpose Baffles
- Vandal Proof
- Q series
- Q Series - Square
- Recessed
- Torsion Baffles & Enclosures
- Cylindrical
- General Purpose Baffles - Square
- Recessed - Square
- Surface Mount Enclosures - Square
- Fire Rated
- 8" Speaker & Analog Clock
- Surface Mount Enclosures
- Mounting Rails
- Mounting Rings & Squares
- T Bar Bridge
- Portable Speakers
- Specialty Speakers
- Life Safety
- Horns
- Sound Masking
- Amplifiers
- GLOBALCOM® Enterprise Communication Ecosystem
- 5400 Series Life Safety Public Address System
- IP Solutions
- DSP / Signal Processors
- AC Power Distribution
- Racks and Cabinets
- Visual Displays
- Microphone & Mic Stands
- Classroom Audio Distribution
- Audio Accessories & Options
- Dante® Enabled Devices
- Buy America Act - Trade Agreements Act
- Discontinued Product
-
Loudspeakers
- Systems
- Markets
- Support
- Resources
- About Us

- HOME /
- GDS-4W End-User Manual /
- GDS-4W End User Manual /
- GDS-4W Advanced Information /
- GDS-4W The Player and Group Window /
- How to Access the Monitoring Window
-
GDS-4W End User Manual
- Information for Customers Upgrading from GDS-4W Version 1.X
- GDS-4W Quick Start Instructions
-
GDS-4W Advanced Information
-
GDS-4W The Player and Group Window
- How to Determine a Player's Status
- How to Access the Monitoring Window
- How to Access a Player's Analytics Report
- How to Restore the Default Player and Group View
- How to Deploy Content and Programs to Players
- How to Generate a Preview Report
- Advanced Player Publishing Options
- Managing and Organizing Players
- Player Alerts
- Searching for Players
- Tagging Players
- Player Properties
- GDS-4W The Scheduling Grid
- GDS-4W The Content Library
- GDS-4W The Playlist Window
- GDS-4W Main Menu
-
GDS-4W The Player and Group Window
- Installation Manuals
- Technical Information
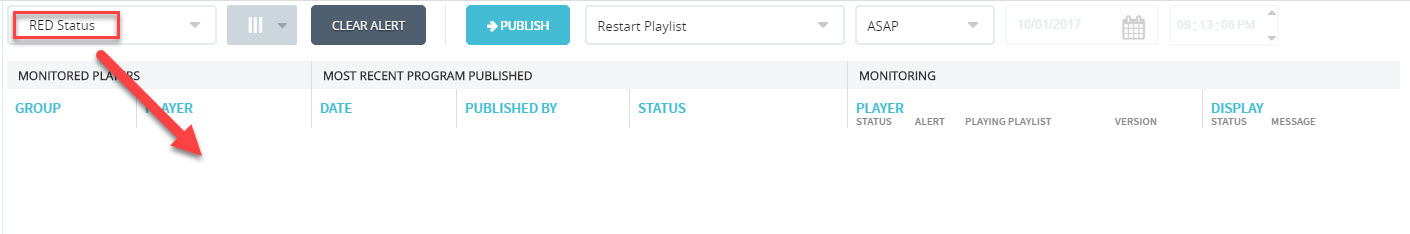
How to Access the Monitoring Window
Clicking a player checkbox selects it so a user can confirm its status in the monitoring window.
Accessing the Player Monitoring Window
To access monitoring data, click the player’s checkbox and then click the Monitoring button above the player list.
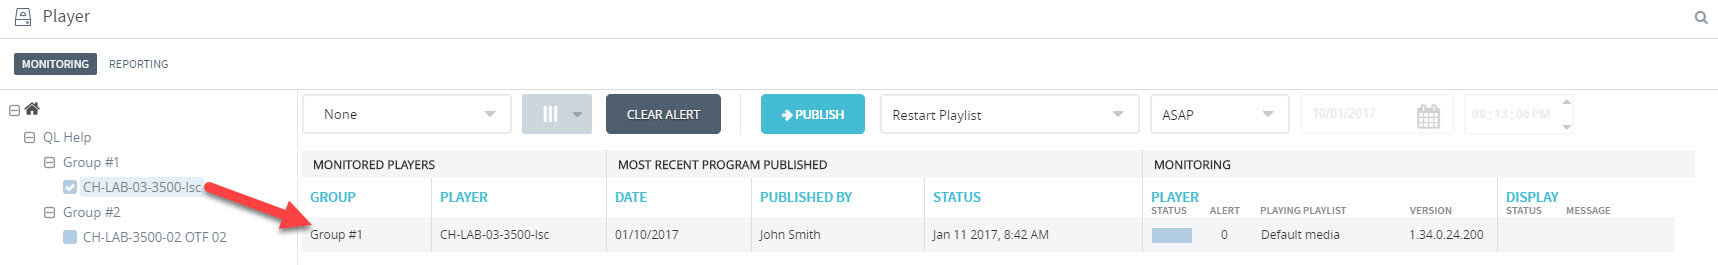
From this window the player’s monitoring information can be accessed to determine it’s current state, access any recorded alerts of events, or even publish content.
The Monitoring Table
MONITORED PLAYERS Section
The table is organized in the following columns:
Group: Shows the selected player’s group(s).
Player: Shows the name of the selected player(s).
MOST RECENT PROGRAM PUBLISHED Section
Date: Shows the date of the last player update sent.
Published By: Shows the name of the user who sent the last update.
Status: If the update was sent by a user, status will read “Done” when the player has received its update. If the update was automatically generated by a GDS-4W Server, the next scheduled update date and time will be shown. In either case, a progress bar will be shown while the update is actively being sent to the Player.
Player is showing offline with the Last heartbeat shown in the status clients on the SaaS – the timezone is referencing UTC Timezone.
MONITORING Section
Player: Shows the status indicator color (blue, yellow, red), the number of recorded alerts since last reset, the name of the currently playing playlist, and the Player software version installed.
Display: When the Player software is equipped with the RS-232 add-on PLUS the PC and display equipped with a RS-232 port, this section will show the display’s status indicator (blue, yellow and red) followed by a status message.
Creating and Managing Monitoring Queries
Queries can be created to assist users with monitoring the status of large numbers of players. The idea behind queries is to let users enter and save specific search parameters so they can be called up by selecting the query by name in a pull down menu.
Creating a New Query
Click the grey button located on the left of the CLEAR ALERT button.
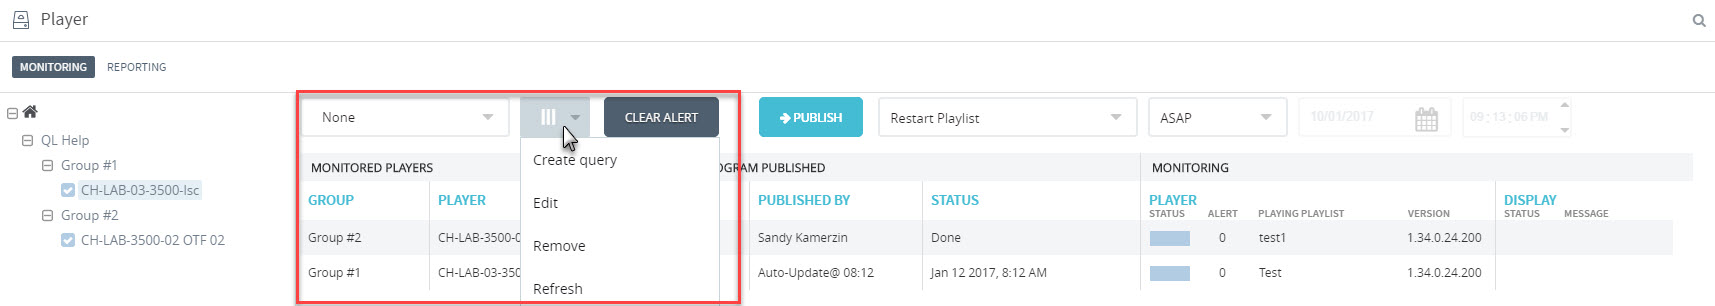
- Click Create Query to add a new query to the list. A new window will appear.
- Enter a descriptive name for the new query. In this example, a query was created that filters the results so only players with a red status will appear in the list.
- Next, select Red as the Player Status.
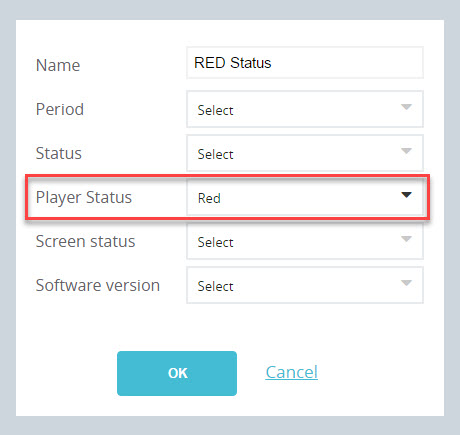
- Click OK to save the new query.
- The new query will now appear when the pull-down field is clicked.
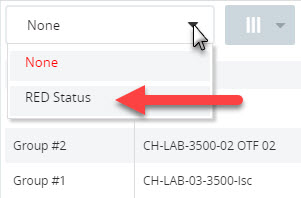
- Result… no players currently showing a red status. Monitoring window is empty.
- Select “None“ to disable filters.
Query Options
Period: Select from the list to filter results by time period.
Status: Select from still downloading content or download complete.
Player Status: Select from player currently running, showing a blue, yellow, or red status.
Screen Status: Select from screen active or inactive.
Software Version: Select from current version or previous version.